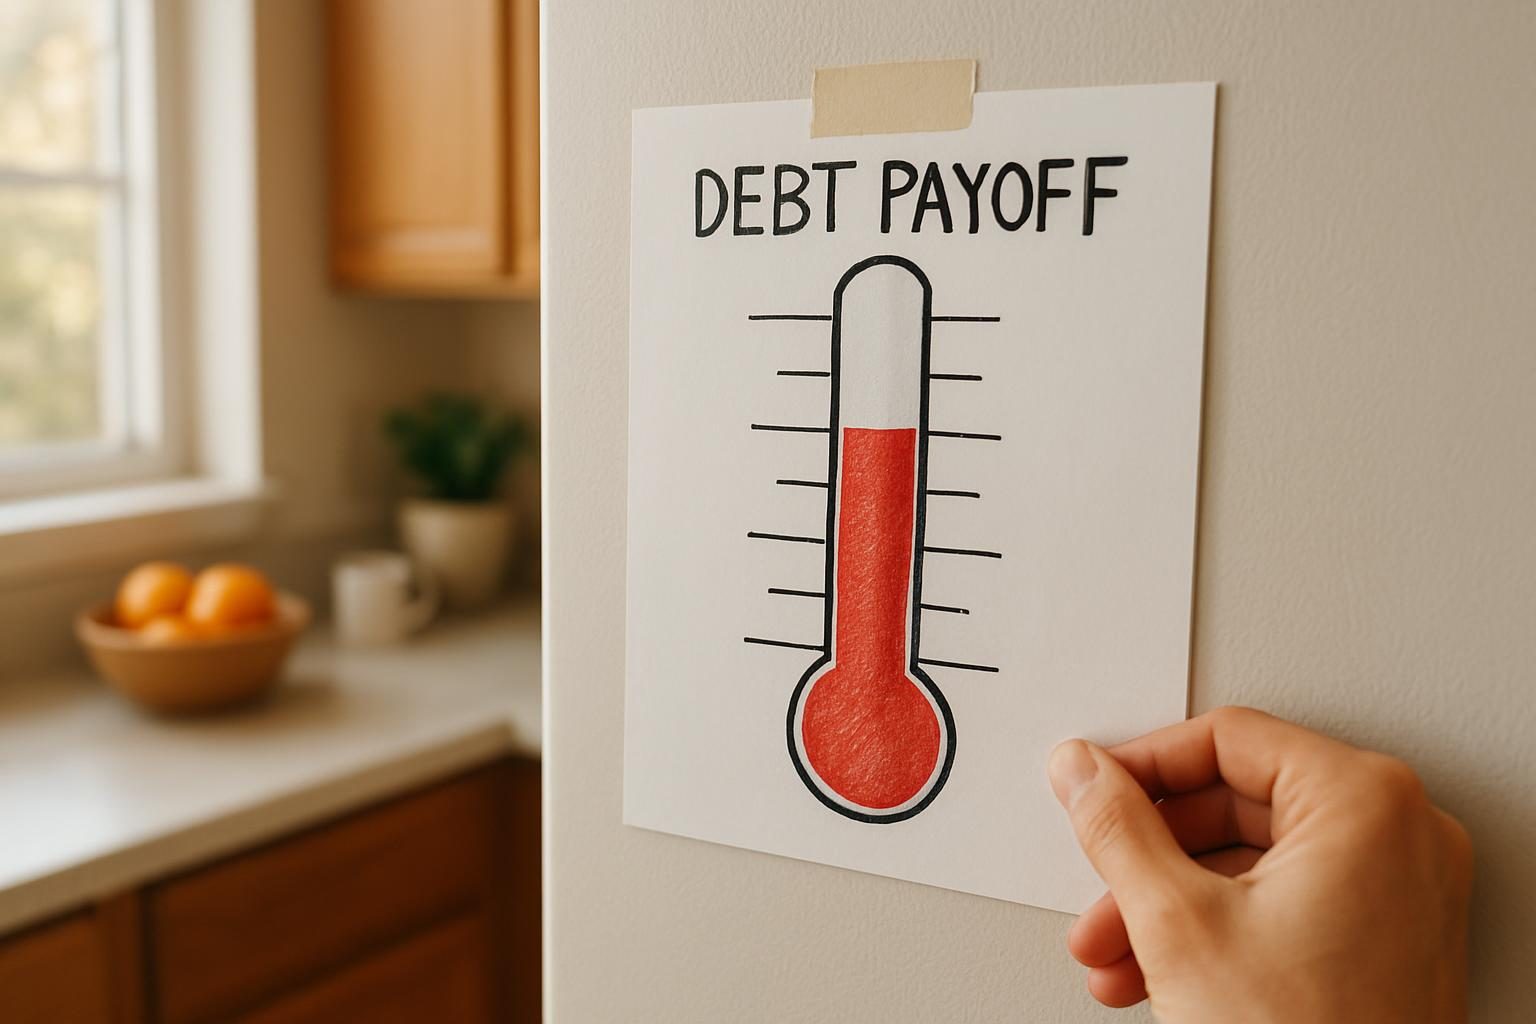
Quick answer: A debt free chart is a visual tracker, like a thermometer, a brick wall or a coloring page, that you fill in as your balance drops. The best one is the chart you will actually update, so pick the style that matches your total debt and how often you want to see progress. Set the chart’s goal to your real starting balance, and pair it with a payoff plan so every colored section reflects real dollars.
Key takeaways
- A chart works because it makes slow progress visible, which keeps you paying when the balance feels huge.
- Thermometers suit one big goal, brick walls suit many small wins, and coloring pages suit families and kids.
- Divide your total debt by the number of boxes to get a clean dollar value per box.
- A chart tracks progress; a payoff plan (snowball or avalanche) creates it.
- Update on a fixed schedule, such as payday, so the habit sticks.
Paying off debt is mostly math, but the math is slow. A balance that took years to build will not vanish in a month, and staring at a statement number that barely moves can drain your motivation.
That is where a debt free chart helps. It turns dollars into something you can color, cross off or stick on the fridge. Want to find a lower rate so each dollar you chart goes further? Request free options to lower your interest rate using the form on this page.
Why a Debt Free Chart Works (and Where It Stops)
A chart does not reduce your balance by itself. What it does is change how you feel about the work, and that matters because debt payoff is a long game.
- It makes progress visible. A balance dropping from $18,400 to $18,150 feels tiny. Five colored boxes feel like a win.
- It creates a small reward loop. Coloring or checking off a box after each extra payment gives you a reason to make the next one.
- It keeps the goal public. A chart on the wall reminds everyone in the house what you are working toward.
- It has limits. If the chart shows only what you have paid, not what interest is adding, it can hide whether you are really moving forward.
The fix is simple: base the chart on your balance, not just your payments. If you want a real timeline behind the picture, run your numbers through the debt payoff calculator first and set your chart to that plan.
Three Debt Free Chart Styles to Choose From
Each style fits a different personality and a different size of debt. Here is how they compare.
1. The thermometer chart
A thermometer has a bulb at the bottom and a tall column marked in dollar steps. You fill it from the bottom up as you pay, so a full thermometer means you are debt free.
- Best for: one clear goal, such as a single credit card, a car loan or a total across all debts.
- Strength: it is simple and easy to read from across a room.
- Weakness: with very large debts, each step can feel too small to notice.
2. The brick wall chart
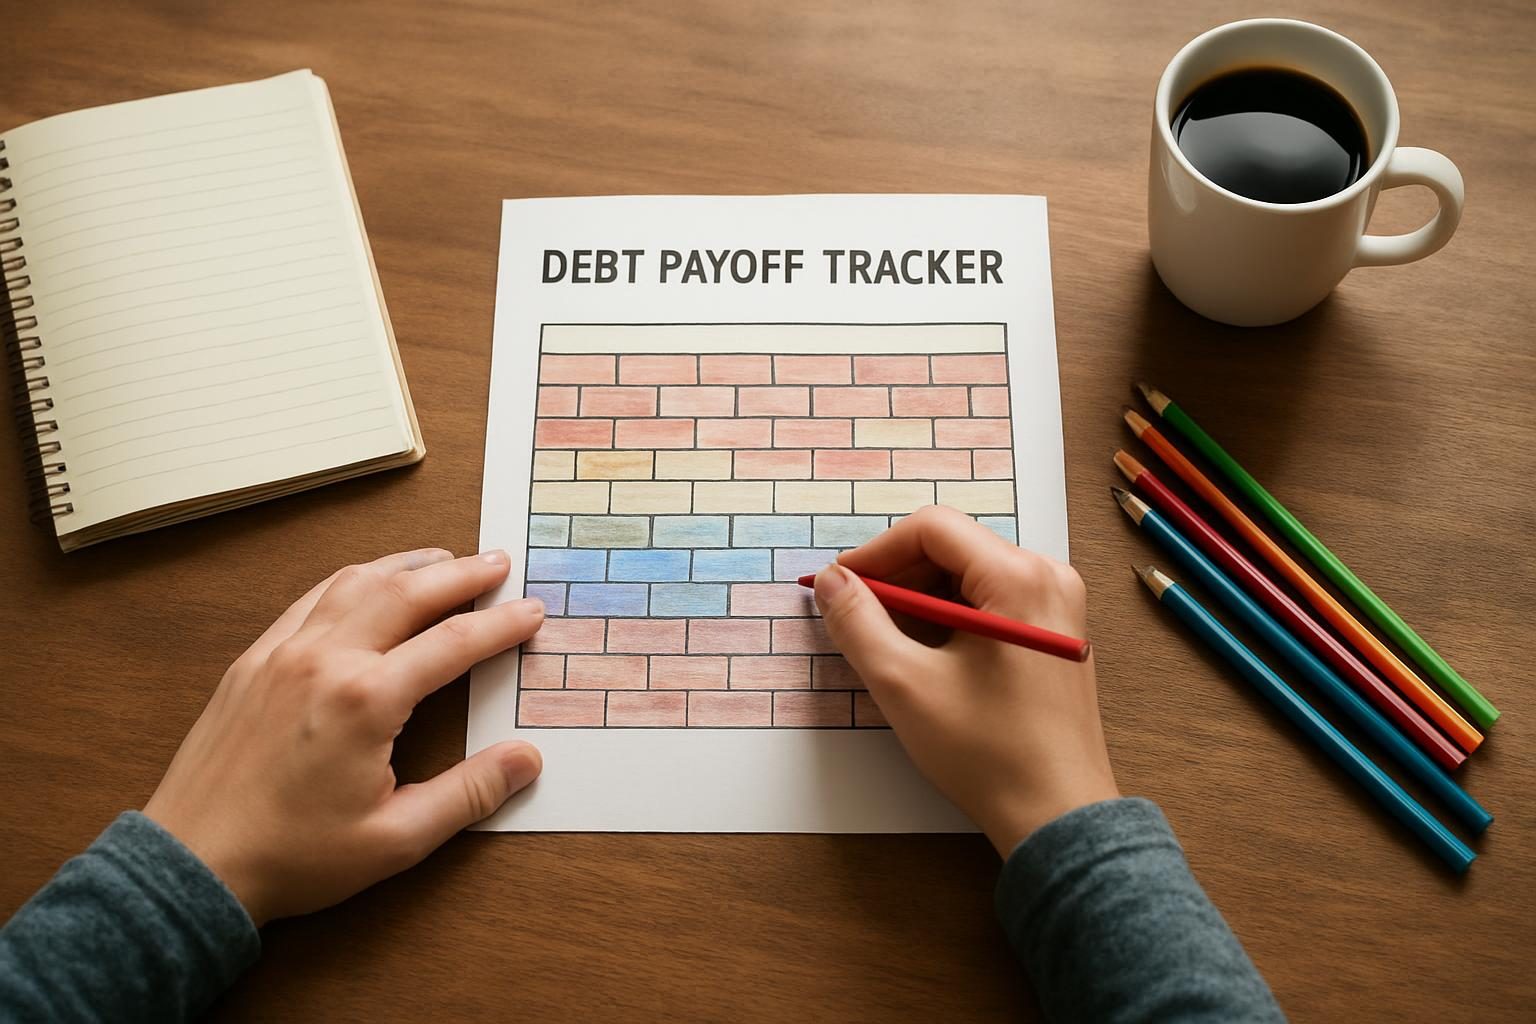
A brick wall is a grid of small bricks, each worth a set dollar amount. Every time you pay that amount, you color in a brick.
- Best for: people who like frequent small wins and have a mid-sized to large total balance.
- Strength: you can color a brick for every extra $50 or $100, so progress shows up often.
- Weakness: it takes a few minutes to set up the grid and decide the brick value.
3. The coloring page chart
A coloring page is a drawing split into numbered sections, such as a mandala, a landscape or a house. Each section matches a payoff amount, and you color it in as you reach it.
- Best for: families, couples and anyone who finds plain charts boring.
- Strength: it becomes a finished piece of art when the debt is gone.
- Weakness: the sections are fixed, so you need a design that matches your total.
You can grab ready-made versions of all three in the free debt payoff tracker printables.
A chart will not pay your debt, but it can keep you paying long enough to finish.
How to Set Up Your Debt Free Chart in Four Steps
Whichever style you pick, setup takes about ten minutes. The key is tying every box to a real dollar amount.
- List every balance. Add up credit cards, personal loans, student loans, car loans and any buy-now-pay-later balances. Use today’s balances, not the original amounts.
- Choose your scope. Decide whether the chart covers all debt or one target debt. Many people use one big chart for the total and a small one for the current target.
- Divide by the number of boxes. If you owe $12,000 and your brick wall has 60 bricks, each brick is $200. For a thermometer with 12 marks, each mark is $1,000.
- Pick an update day. Choose a fixed day, such as payday or the first of the month, and color in whatever you paid since the last update.
Pro tip: Count only principal. If you pay $400 on a card but $90 of it is interest, only $310 is real progress. Color in the smaller number so your chart matches your balance.

Pair Your Chart With a Payoff Plan
A chart shows how far you have come. A plan tells you which debt to attack and in what order. You need both.
- Debt snowball: pay the smallest balance first for quick wins. This pairs well with a brick wall, since you finish small debts fast and color in lots of bricks early. See the debt snowball worksheet for a fill-in version.
- Debt avalanche: pay the highest interest rate first to cut total interest. This pairs well with a thermometer, since the biggest-cost debt becomes your single target. Learn the steps in the debt avalanche method guide.
- Not sure which to pick? The debt payoff plans guide compares both side by side.
If you want a fast, flexible way to see how extra payments shorten your timeline, try the Debt Burn-Down Calculator and then size your chart to match.
Every dollar of interest you avoid is another box you get to color sooner.
Ways to Make Your Debt Free Chart Move Faster
Once the chart is on the wall, the goal is to fill it quicker. A few moves can speed things up without needing a bigger paycheck.
- Lower your interest rate. A 0% balance transfer or a lower-rate consolidation loan can mean more of each payment hits principal. Read the balance transfer guide to see how this works, and check the fee and the end-of-promo rate first.
- Add a challenge. Short bursts of extra saving fill several boxes at once. The 52-week money challenge chart is one way to do it.
- Collect small amounts. The debt snowflake method turns spare change and one-off windfalls into steady progress.
- Celebrate milestones cheaply. Mark each quarter of the chart with something free, like a favorite home-cooked meal. Our upcoming guide on debt payoff milestones covers more ideas.
Keep expectations honest. Your pace depends on your income, your rates and your other bills, and no chart can promise a specific payoff date. Run your own numbers, and consider talking to a nonprofit credit counselor or a qualified financial professional if your situation feels unmanageable.
Common Debt Free Chart Mistakes to Avoid
- Setting boxes too big. If each box is $1,000 and you pay $150 a month, you will wait ages for any reward. Shrink the box value.
- Forgetting new charges. If you keep using a card, the chart will fill while the balance stays flat. Pause new spending on the cards you are paying off.
- Ignoring interest. Track your balance, not only your payments, as noted above.
- Skipping updates. A chart you ignore for two months stops working. Put the update on your calendar.
- Hiding it away. A chart in a drawer is not a motivator. Put it where you will see it daily.
For a longer view of the habit side, our planned guide on how to stay motivated paying off debt will go deeper.
Ready to see if a lower rate can fill your chart faster? Request free, no-obligation rate-lowering options with the form on this page. You can also browse the lower your rate page to learn what is available.
Frequently Asked Questions
What is a debt free chart?
It is a printable or hand-drawn tracker, such as a thermometer, brick wall or coloring page, where you mark off sections as your balance falls. Each section stands for a set dollar amount, so you can see progress at a glance.
How do I decide how much each box is worth?
Divide your total debt by the number of boxes on your chart. For example, $9,000 across 45 bricks makes each brick $200. If that feels too slow, use more boxes so you get rewarded more often.
Should my chart track one debt or all of them?
Either works. A single chart for your total gives the big picture, while a smaller chart for your current target debt gives quick wins. Many people use both.
Does a chart replace a payoff plan?
No. A chart shows progress but does not decide which debt to pay first or how much to pay. Use it alongside a snowball or avalanche plan, and use a calculator to check your timeline.
Is it better to use a printable or an app?
It is personal preference. Printables are visible on a wall and need no login, while apps can update automatically. Pick whichever you will check most often.
Get free options to lower your interest rate
Partners will share free, no-obligation options so more of each payment goes toward your balance.